Folk i Fortiden
The challenge
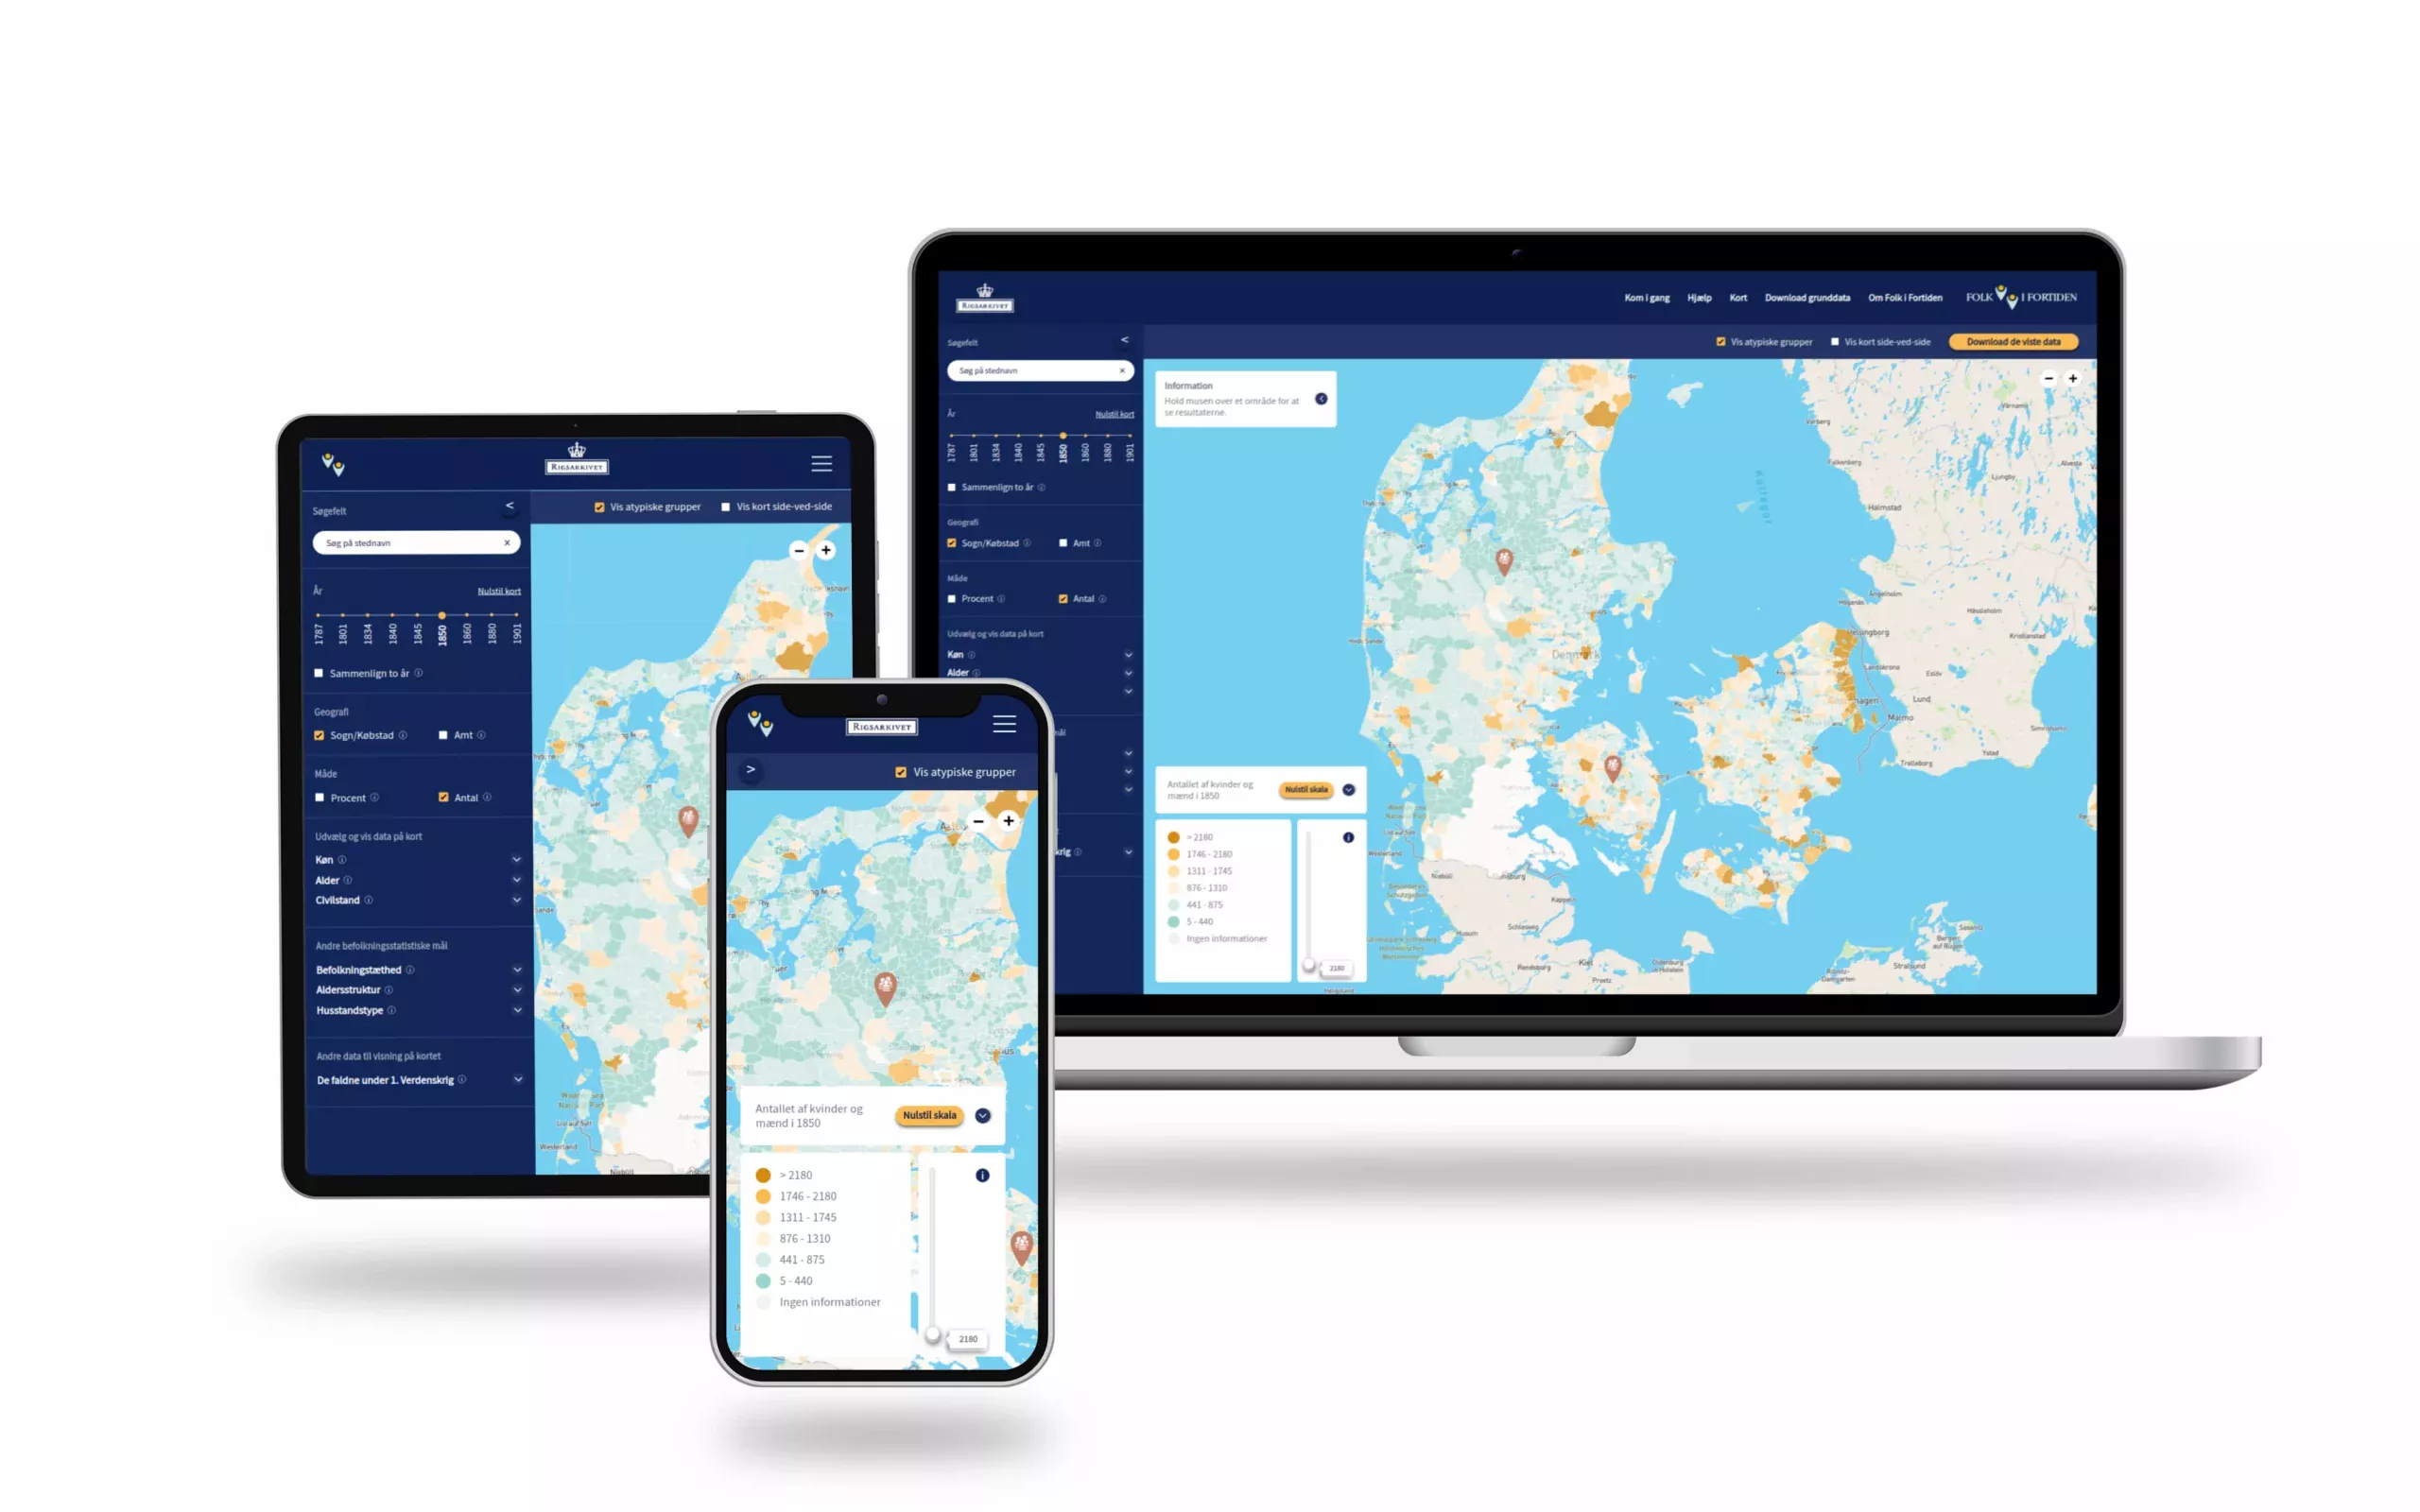
Rigsarkivet tasked us with creating a highly interactive and informative map-based platform to display historical demographic data of deceased individuals in Denmark. This platform needed to offer detailed demographic insights, such as average age, household size, and population density, categorized by towns, parishes, and counties. The key challenges included:
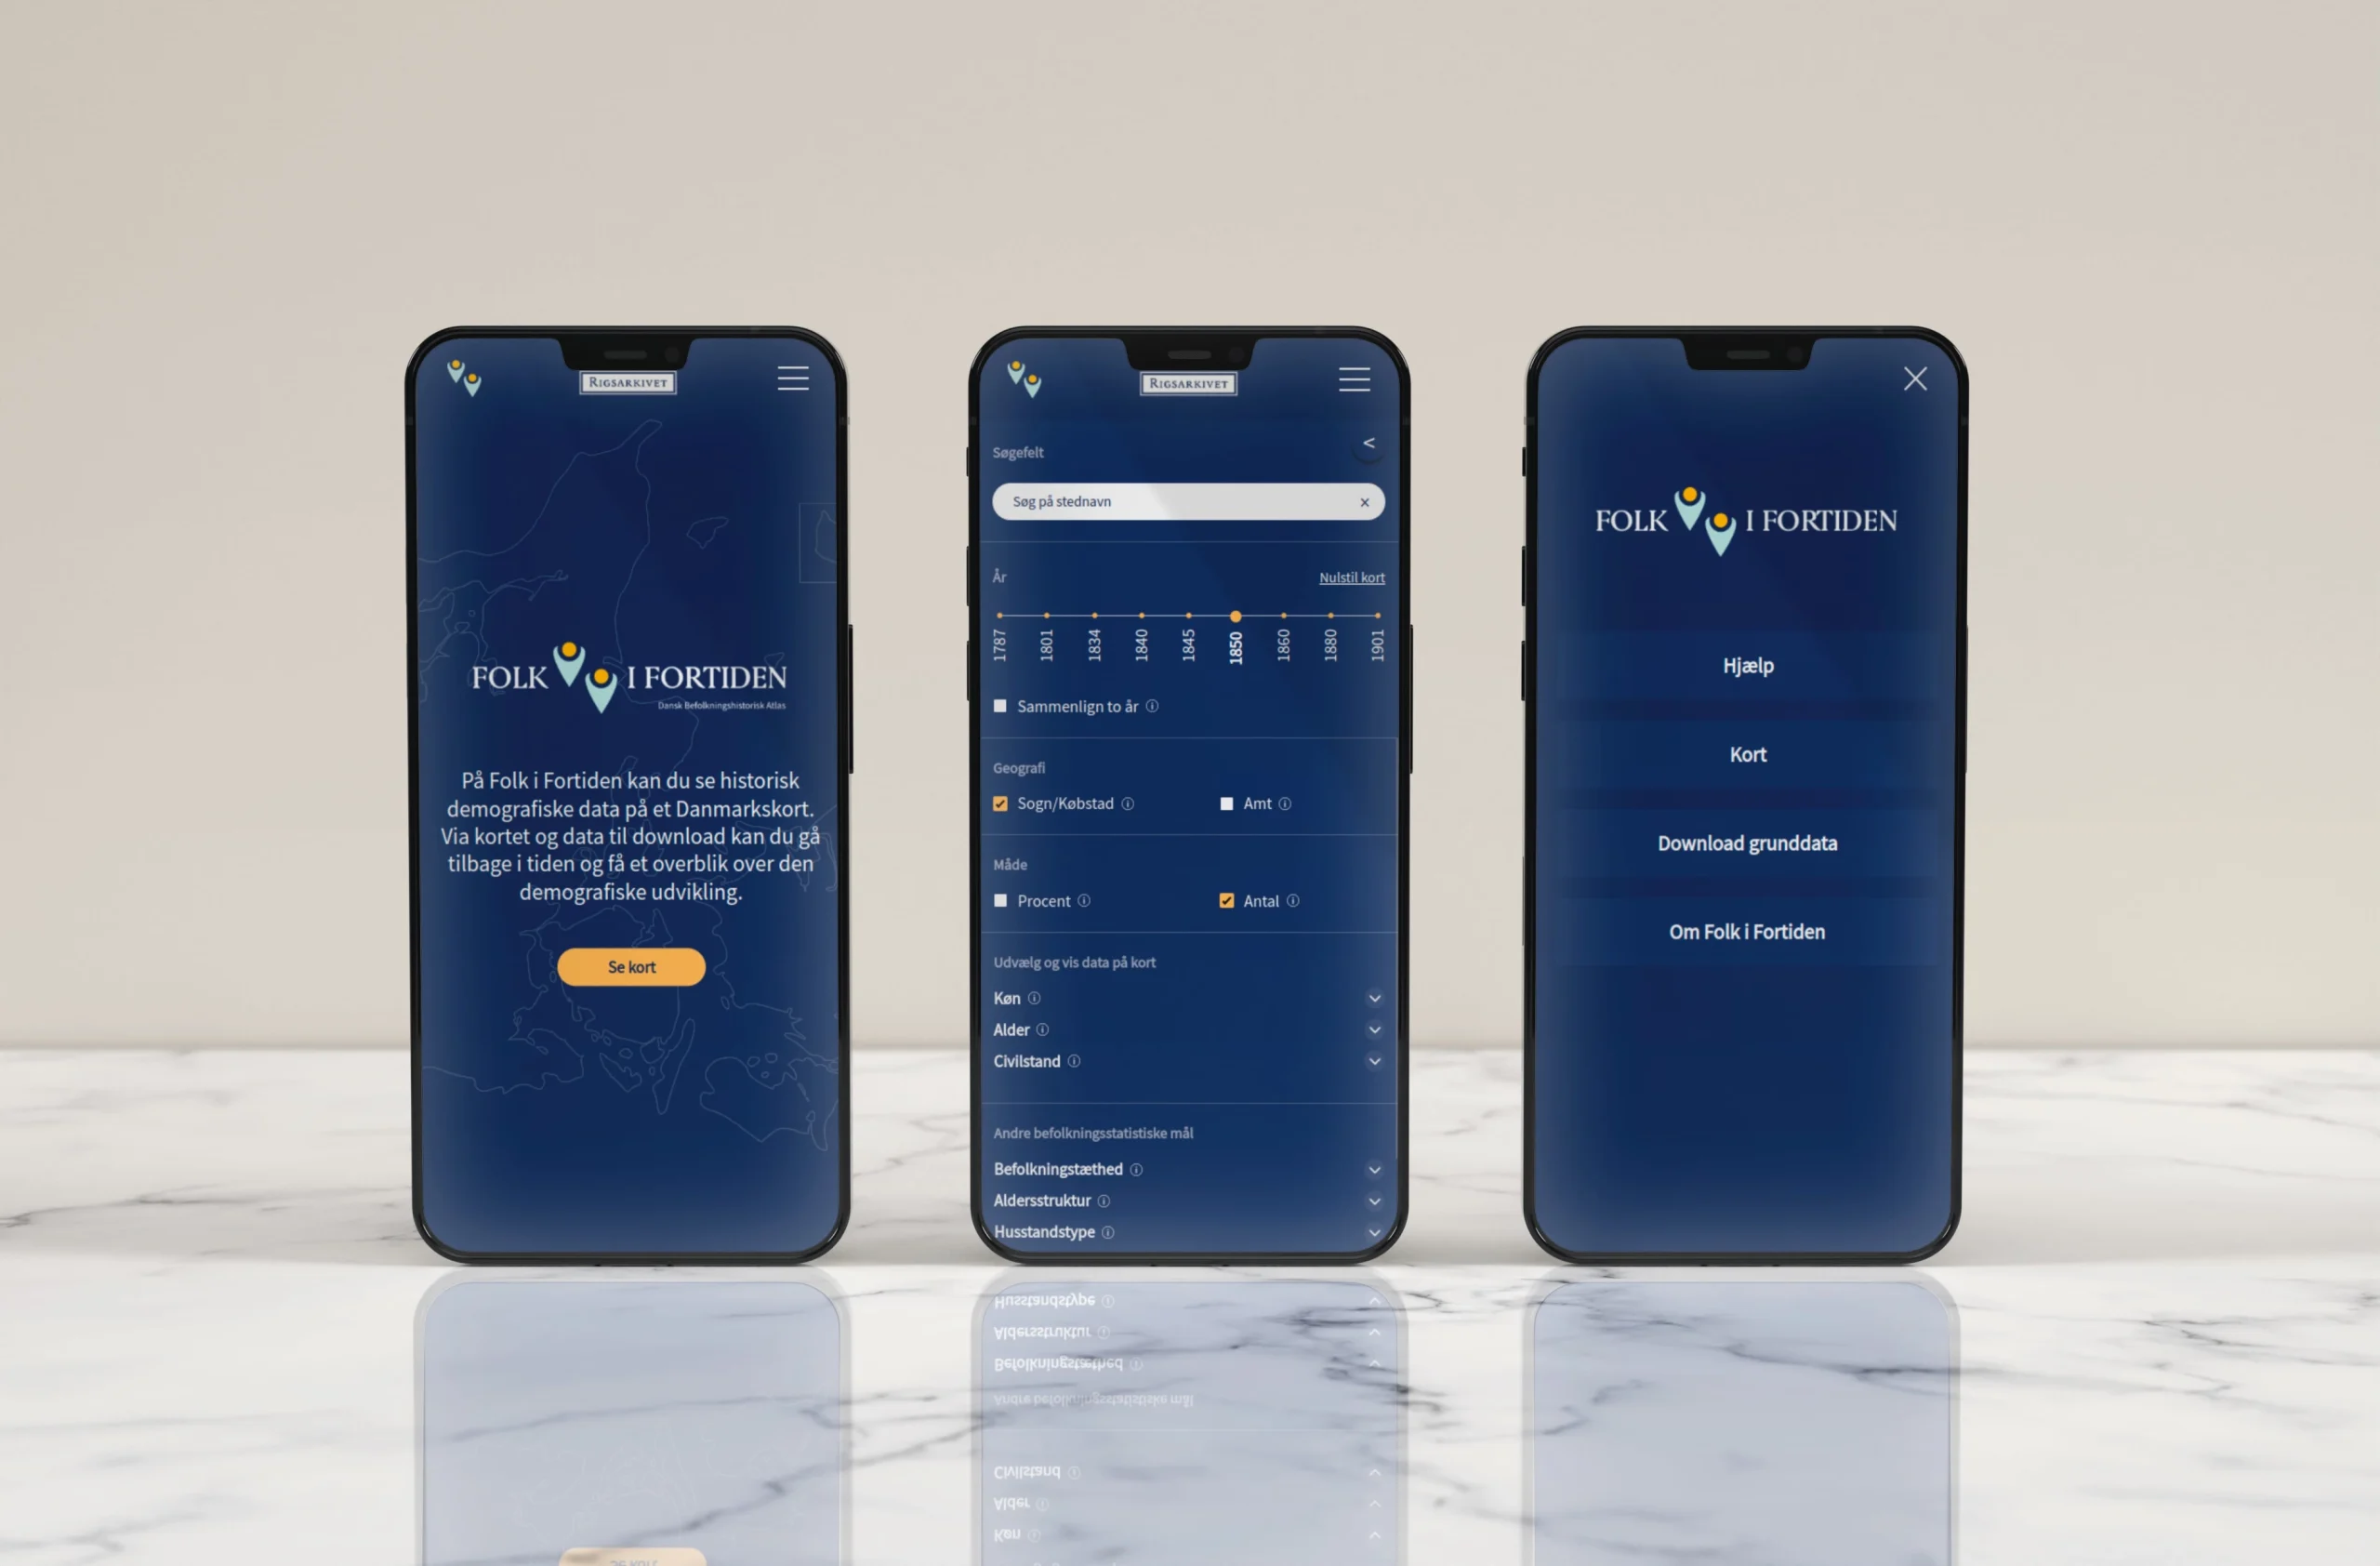
- Enabling users to filter data by year, gender, age, and civil state (married/single).
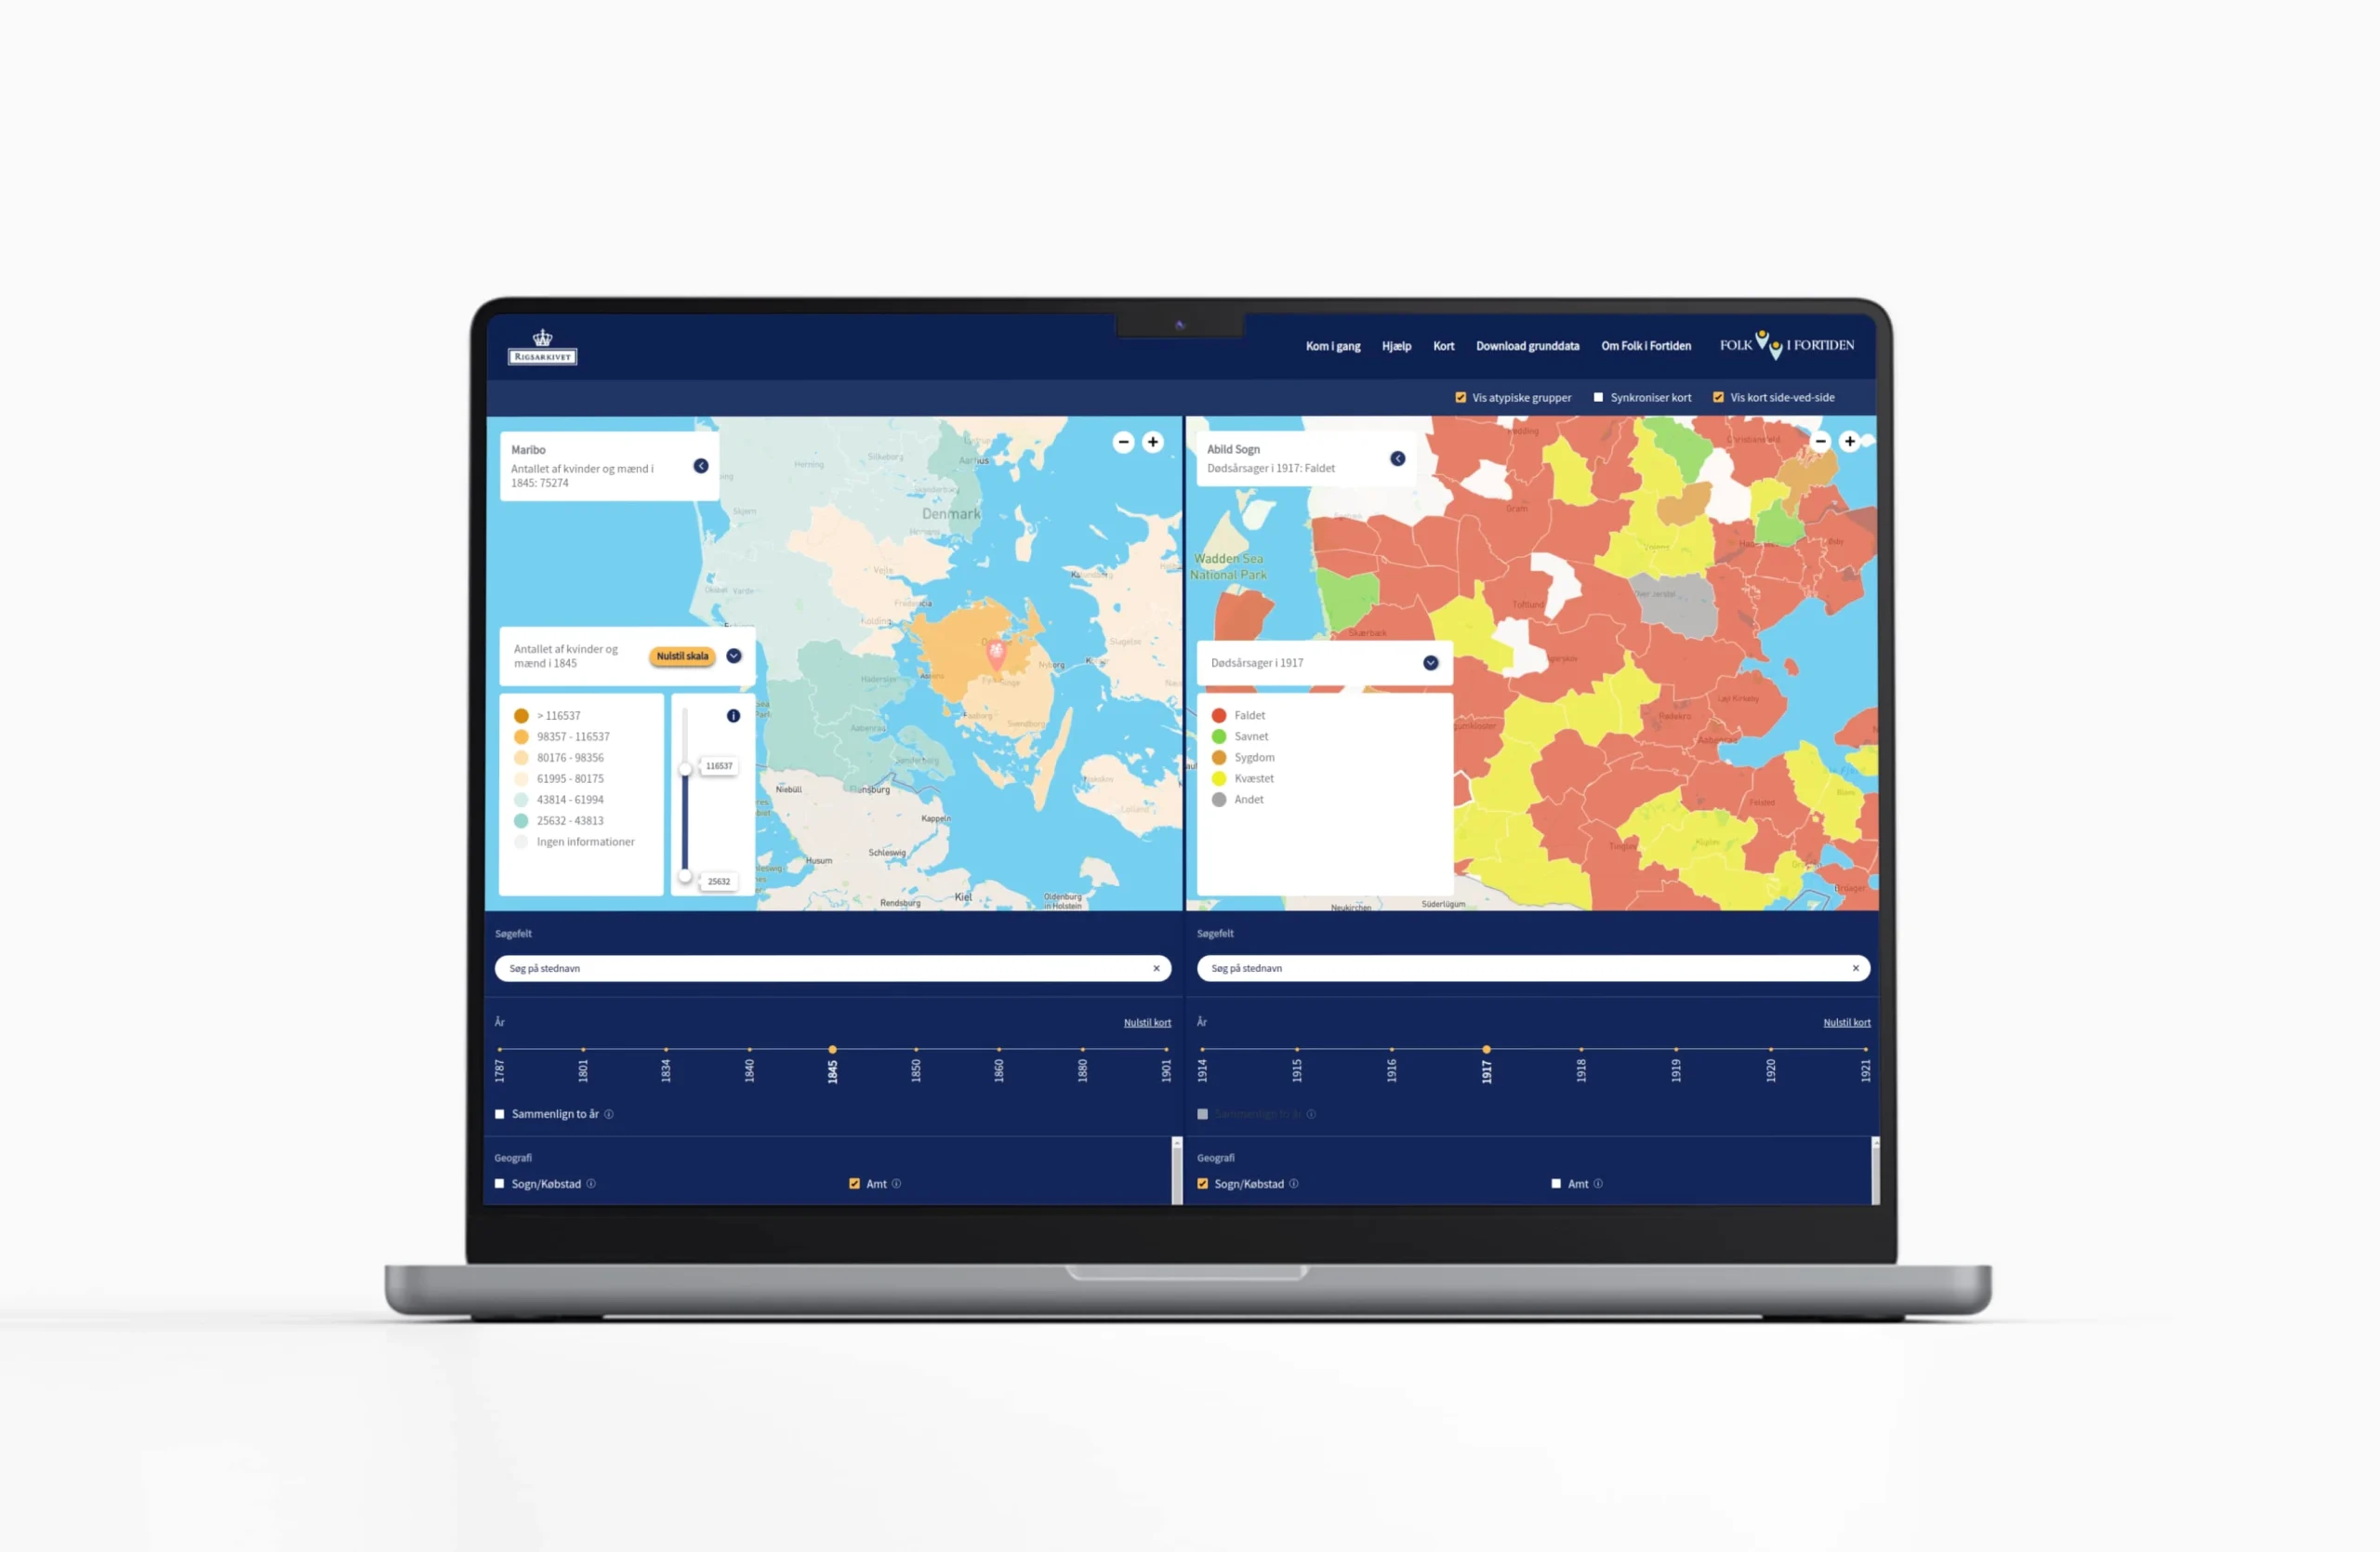
- Allowing for comparisons between different years to visualize demographic changes over time, and possibility to display 2 maps.
- Providing administrators with a simple way to upload new data via CSV, pin additional points of interest on the map, and have the data immediately accessible.
- Implementing WCAG 2.1 accessibility compliance, including an interactive tutorial that explains how visitors use the site.
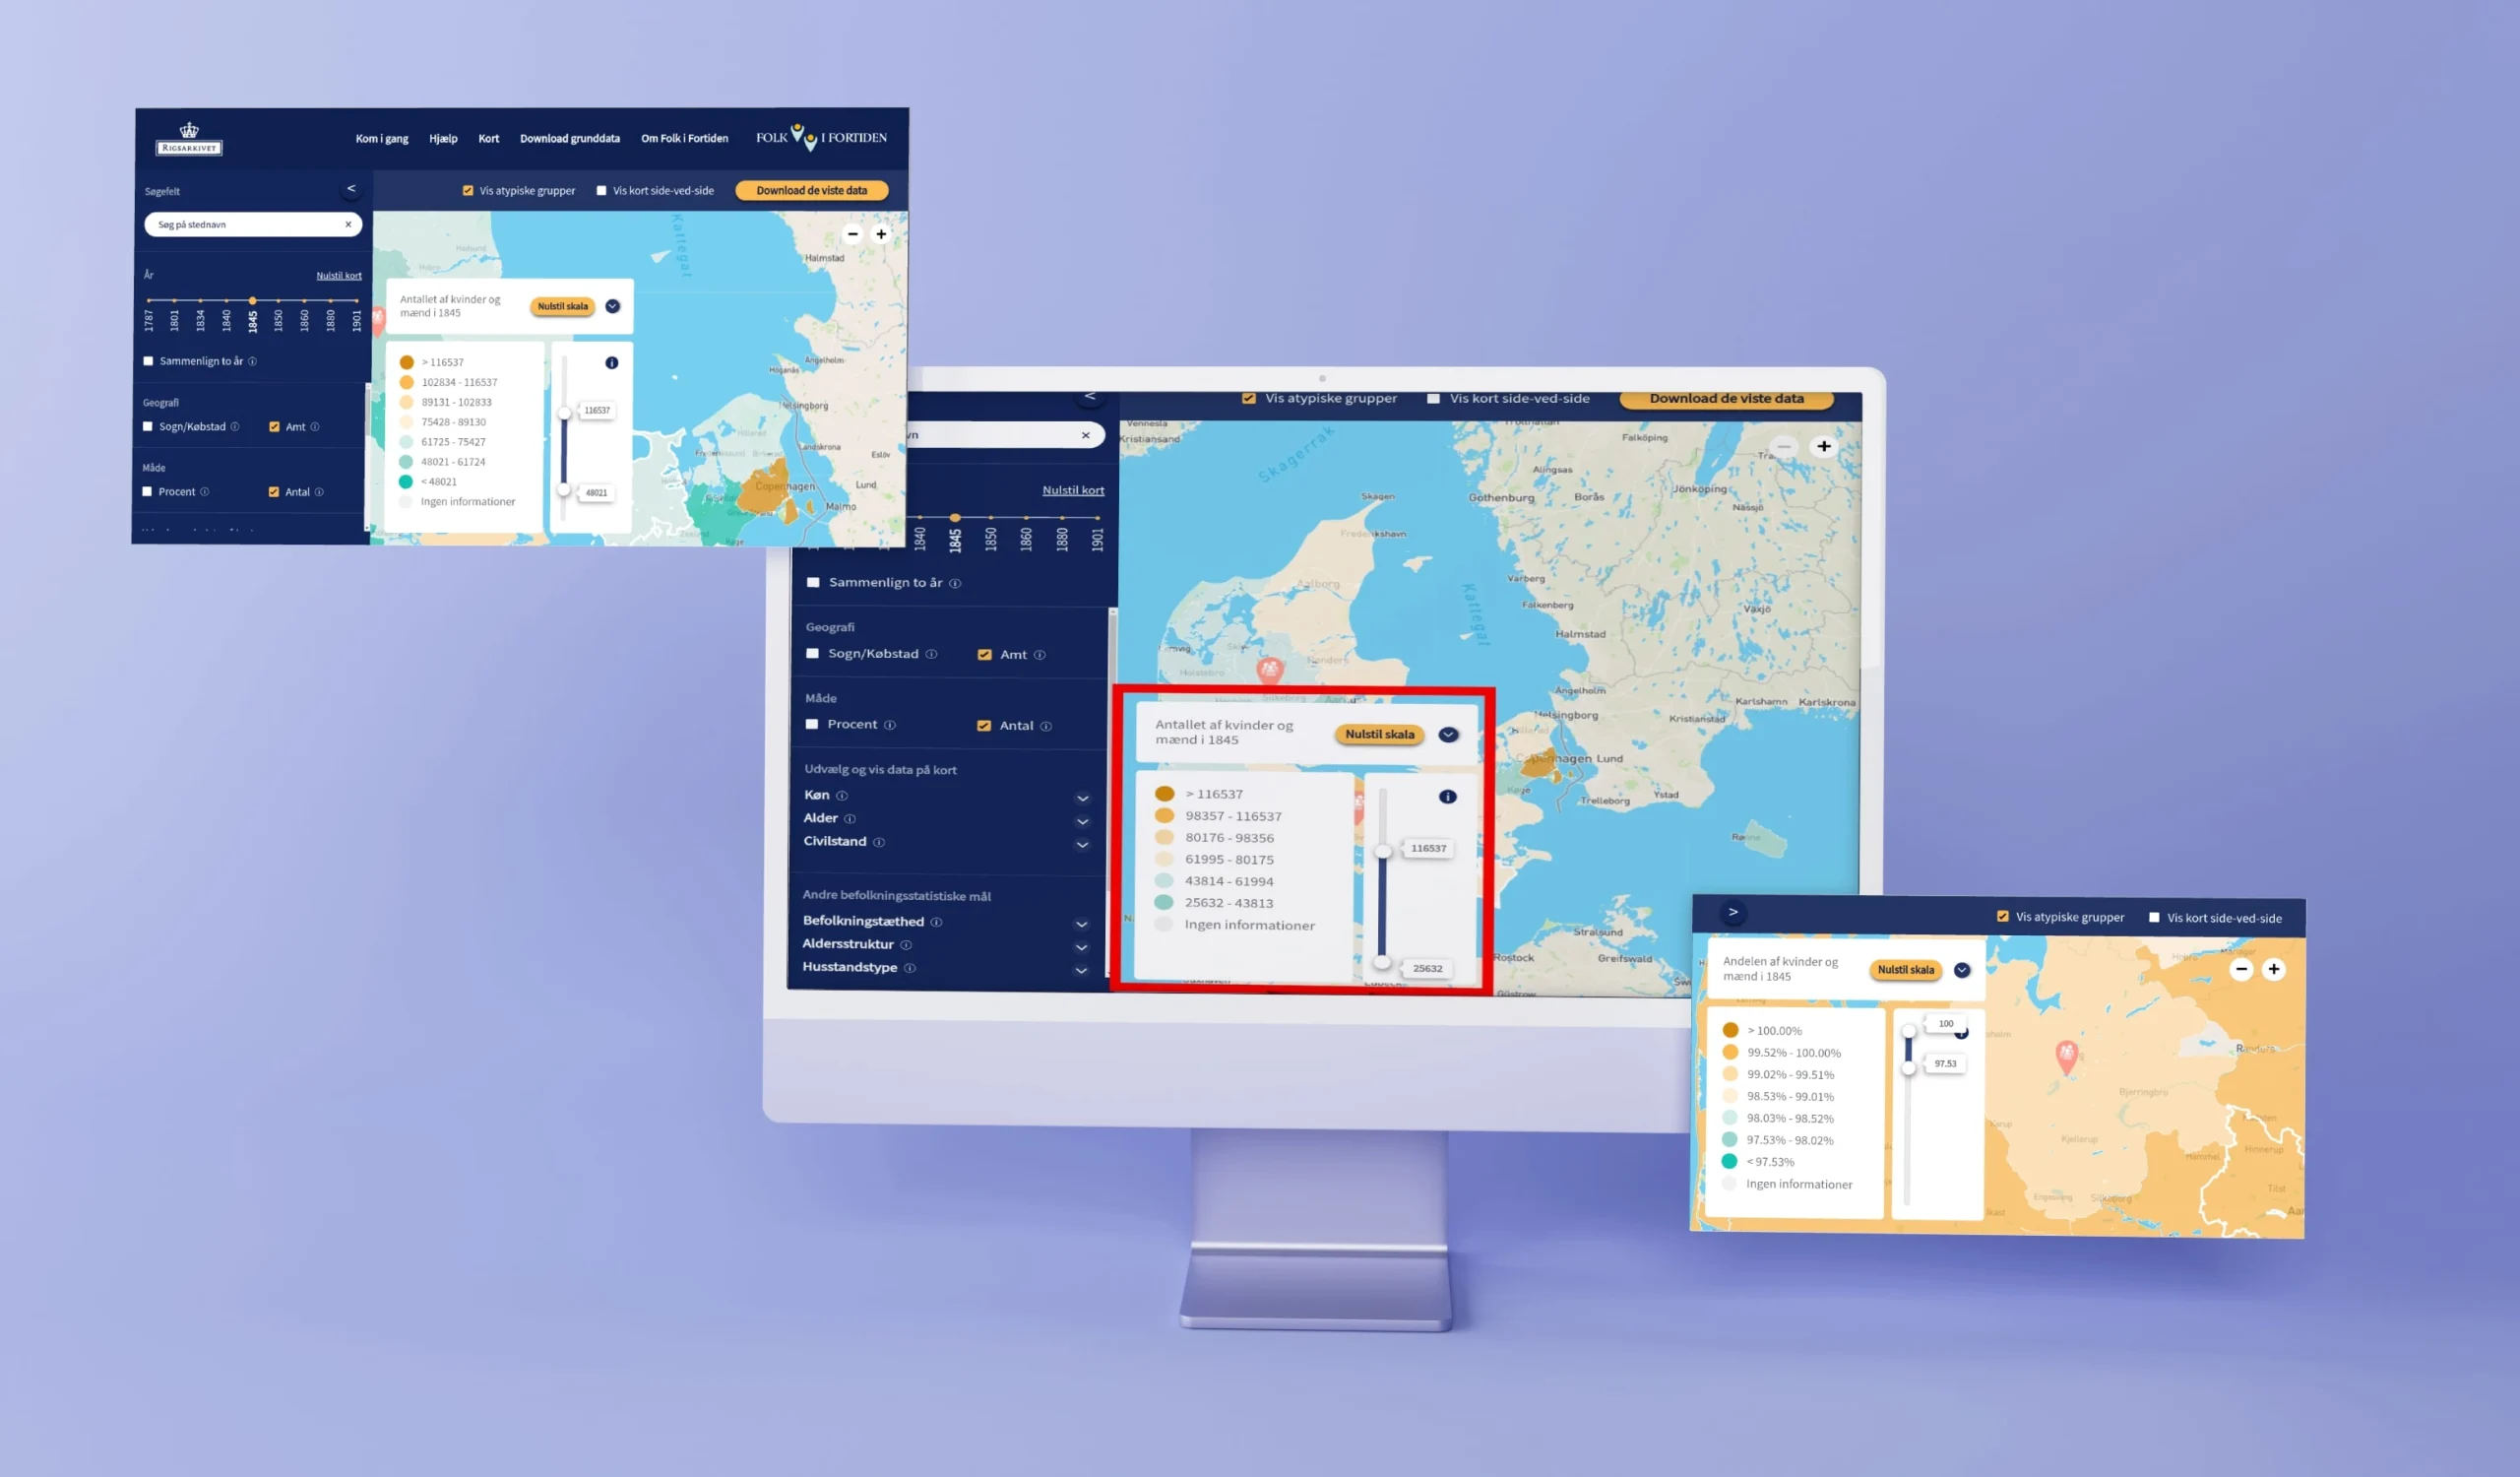
The major challenge arose with the color scale used to represent data. The initial design used a fixed color range (e.g., values 1–20 in green, 20–40 in red). However, this fixed scale was ineffective when data distributions varied widely. For instance, if a user selected a year where all values were above 45, the map would display uniformly in one color (e.g., red), failing to show meaningful variations. We needed a dynamic scale that would automatically adjust to each data set, providing visual clarity and insight into subtle differences within the data.
Approach
To address these requirements, we divided the project into several key components, each addressing a specific functional or technical challenge.
- Platform Framework: We chose WordPress as the CMS to give Rigsarkivet control over backend data management.
- Data Handling: The administrators of the site were used to work with data in a CSV file. We understood the importance of providing Rigsarkivet’s administrators with the tools they needed to manage the platform effectively, so we designed an intuitive interface that would allow them to upload new data easily and add relevant map pins with historical context.
- Balancing Performance and Accessibility: With a large amount of historical data and various interactive features, we emphasized both speed and ease of use. We also adhered to accessibility standards (WCAG 2.1) throughout development.

Technical Details
- Interactive Map with Dual Comparison Mode
- We utilized the Leaflet JavaScript library to develop an interactive map that supports dual-map views. This setup allows users to easily compare data from different years by displaying two maps side-by-side.
- Aggregated data like population density, average age, and household size were mapped with intuitive color scaling, adjusting dynamically to reflect data variations clearly.
- We implemented filter options for gender, age, civil status, and year, allowing users to explore data subsets in depth.
- Dynamic Scale and Data Representation
- To solve the color scaling issue, we developed a Python script that calculates data ranges dynamically based on the selected dataset’s distribution.
- The script uses a normal distribution model to analyze the minimum and maximum values of each dataset, then divides these values into appropriate intervals that fit the data. For instance, if the minimum value in a selected year was 45, the script would dynamically set the color ranges to ensure that variations within that range (e.g., 45–70) were visible across different colors.
- This approach ensured that every map view would have a meaningful color distribution that highlighted data variations, rather than displaying uniformly colored maps. Additionally, we provided a user-adjustable range feature for manual fine-tuning of color scale intervals.
- Optimized Data Handling
- We used server-side
grepto filter large datasets directly on the server, bypassing slower PHP-based filtering. This optimization sped up data queries and improved the map’s responsiveness when handling complex filters and larger data volumes.
- We used server-side
- WCAG Accessibility and Interactive Tutorial
- We implemented IntroJS to create an interactive tutorial, guiding users through the platform’s features, and ensuring the site met WCAG 2.1 standards for accessibility.
- Data Download Feature
- Users can export data subsets to CSV based on selected year, county, and other demographics. This feature provides a valuable tool for researchers and historians who want to conduct deeper analyses or share findings outside the platform.
Results
The result was a dynamic, visually engaging platform that effectively brought Danish history into focus through demographic data. The “Folk i Fortiden” map empowers users to interact with and interpret data in a meaningful way, making history more accessible and relevant. By giving Rigsarkivet’s team the tools to easily update and enrich the map, we ensured that this resource would continue to grow, offering lasting value for researchers, genealogists, and the public.
**Disclaimer**: This project is owned